Profiling in ROS 2 / Nav2
Overview
This document explains one method for profiling applications in ROS 2 / Nav2. The aim of profiling is to generate files that can be analyzed to see where compute time and resources are spent during the execution of a program. This can be useful to determine where the bottlenecks in your program exist and where things might be able to be improved.
The following steps show ROS 2 users how to modify the Nav2 stack to get profiling information about a particular server / algorithm when they encounter a situation they’d like to understand better. This tutorial applies to both simulated and physical robots.
Preliminaries
This tutorial makes use of two tools, callgrind from the Valgrind set of tools and kcachegrind. Valgrind is used to get the profiling information about the program and kcachegrind is the visualization engine used to interprete this information to do useful work.
Thus, we must install them.
sudo apt install valgrind kcachegrind
More information can be found in the Valgrind manual including additional valgrind arguments that can be used to specify more information.
Generally speaking, to use valgrind we need to compile with debugging information. This can be done by passing -g as a compiling option or compile CMAKE_BUILD_TYPE as Debug or RelWithDebInfo. Then, we run our program using valgrind to capture the run-time statistics for later analysis. These are stored in callgrind.out.XXX files, where the suffix is the PID of the process. kcachegrind is used to visualize and analyze the results of the program execution.
      # CMakeLists.txt
add_compile_options(-g)
cmake -DCMAKE_BUILD_TYPE=RelWithDebInfo
valgrind --tool=callgrind [your-program] [program options]

kcachegrind callgrind.out.XXX
Profile from a Node
As in our generic example, for a given node, we need to compile with debug flags to capture the information for profiling with Valgrind. This can be done easily from the commandline. Note that we use --packages-select to only compile with this flag for the packages we want to profile nodes within.
colcon build --packages-select <packages of interest> --cmake-args -DCMAKE_BUILD_TYPE=RelWithDebInfo
Optionally, you may add the following line to the CMakeLists.txt of the package you’re looking to profile. This may be preferable when you have a workspace with many packages but would like to only compile a subset with debug information using a single colcon build invokation.
It is important that this should be added to both the host server and plugin packages(s) if you would like the results of a plugin’s run-time profile.
add_compile_options(-pg)
After either compiling method, this node should be run in its own terminal to isolate it from the rest of your system. Thus, this should not be composed in the same process as other nodes. To run a ROS 2 node with valgrind, this can be done from the commandline via:
ros2 run --prefix 'valgrind --tool=callgrind' <pkg> <node> --all-other-launch arguments
An example of this might be used for profiling the controller server with a particular controller plugin loaded. Both nav2_controller and the plugin package of interest are compiled with debug flags. In the example below, we are running a ROS 2 node with remapped topics and a path to its parameter file:
ros2 run --prefix 'valgrind --tool=callgrind' nav2_controller controller_server --ros-args -r __node:=controller_server -r cmd_vel:=cmd_vel_nav --params-file /path/to/nav2_bringup/params/nav2_params.yaml
Once sufficient data has been collected, cleanly exit the process with Control+C.
Profile from a Launch File
Just as in the Node example, we must also compile with debug flags when profiling a node from launch. We can complete the same valgrind call as from the commandline as within a launch file using launch prefixes.
As our example before, this is how we’d launch the controller_server node from inside a launch file.
start_controller_server_node = Node(
    parameters=[
      get_package_share_directory("nav2_bringup") + '/params/nav2_params.yaml',
      {'use_sim_time': use_sim_time}
    ],
    package='nav2_controller',
    executable='controller_server',
    name='controller_server',
    prefix=['xterm -e valgrind --tool=callgrind'],
    output='screen')
Note that just like before, we should isolate this process from others. So this should not be run with any other nodes in this launch file nor use node composition when profiling a particular node.
Once sufficient data has been collected, cleanly exit the process with Control+C.
Interpreting Results
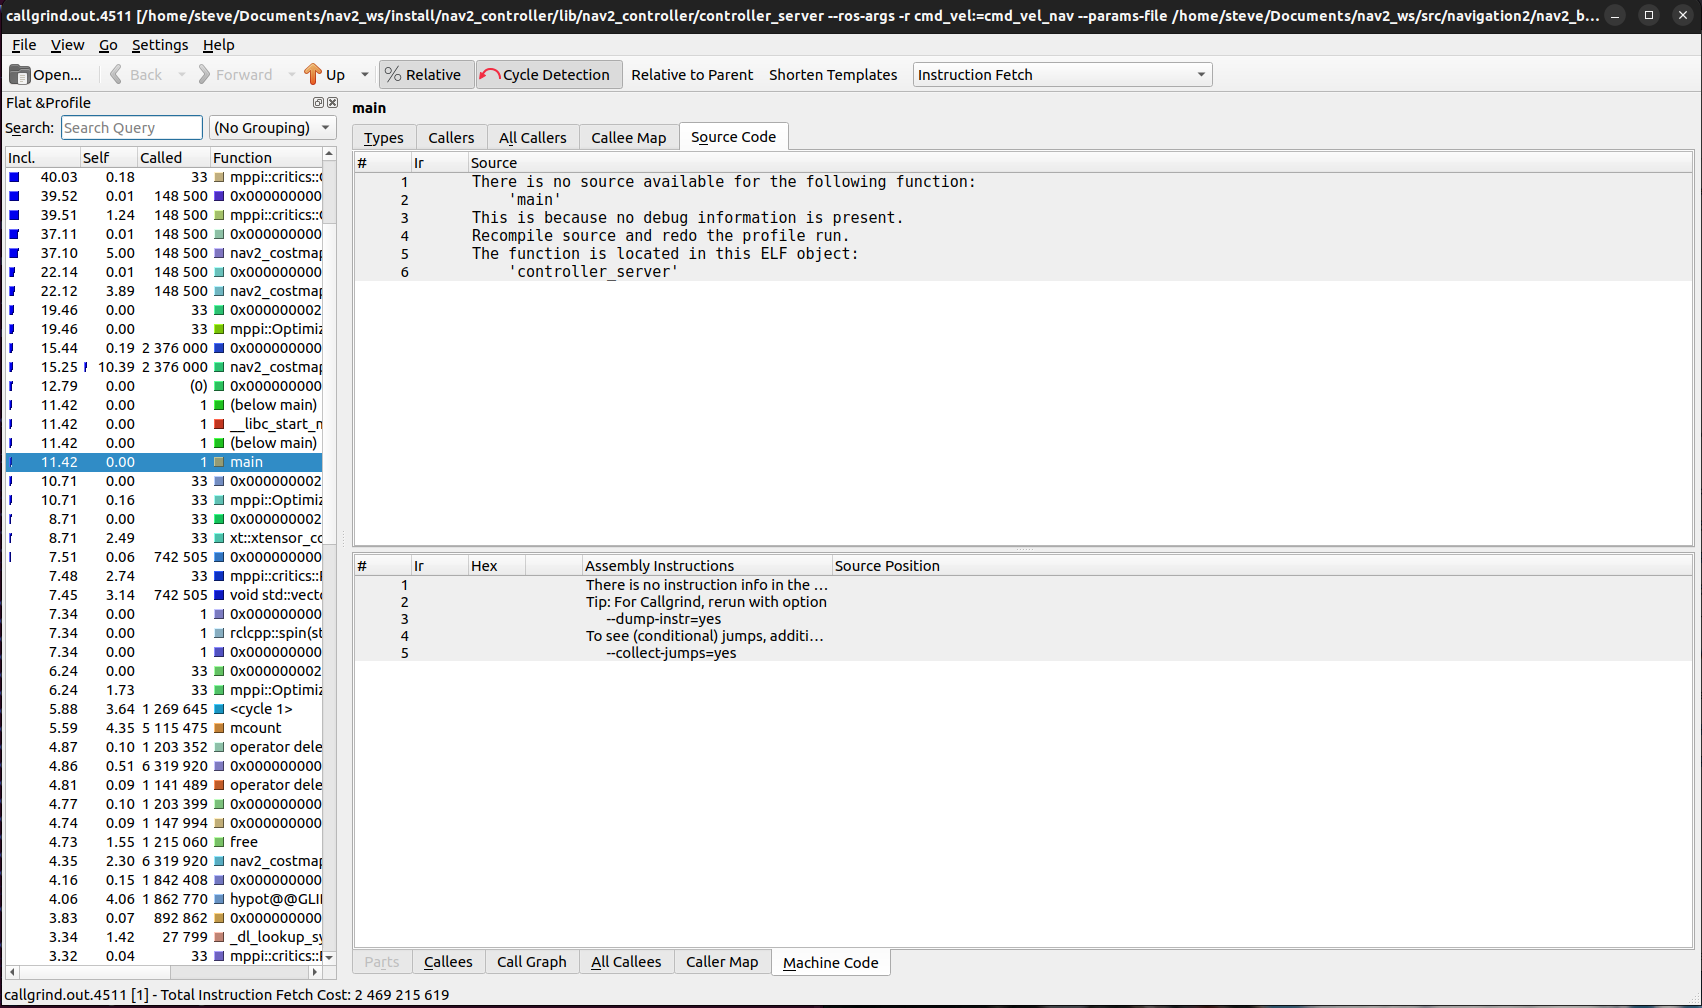
Once you have your callgrind results, regardless of if you did it through a node, launch file, Nav2, or elsewhere, now we can analyze the results from the profiler to identify bottlenecks or potential areas of improvement. Using kcachegrind:
kcachegrind callgrind.out.XXX
This should open a window looking like below. The left side shows all of the calls and their relative percentages of compute time they and their children functions utilized.
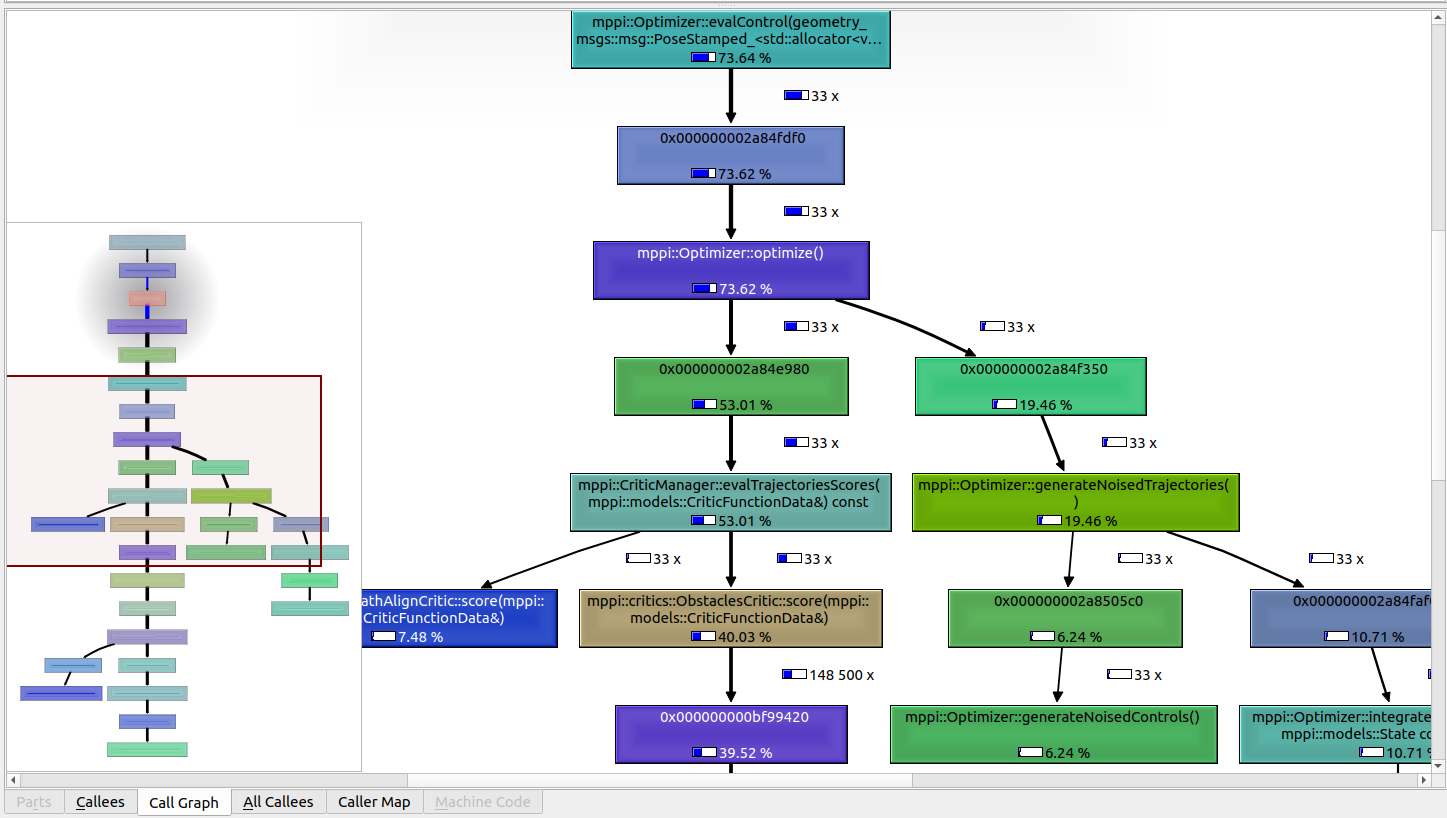
If you select the top level entry on the left sidebar, then select “Call Graph” at the bottom of the right workspace, it should show you a call graph of where the compute time was spent as a graph of method calls. This can be exceptionally helpful to find the methods where the most time is spent.